Back
Share
Finding New Options-Based Trading Ideas
This article discusses strategies for finding new options-based trade ideas. It recommends scanning financial news channels and Twitter feeds for option ideas, emphasizing the importance of tracking market sentiment using tools like Finviz's market heatmap, which visualizes sector performance. The article also highlights the significance of stock screening criteria such as volume and moving averages, before delving into in-depth chart analysis with TradingView, using indicators like MACD, RSI, VRVP, and moving averages. Finally, it stresses the need to stay updated with the latest business news through resources like Yahoo Finance and TradingView's news alerts for timely trading insights. This heatmap allows traders to quickly assess which sectors are outperforming or underperforming, offering a strategic starting point for trade idea generation.
The following outline provides a step-by-step guide for finding new options-based trade ideas using various free tools and technical indicators.
1. Scan for Ideas
Watching financial news channels like CNBC in the morning is a common practice for investors. These channels provide insights into market developments, stock picks, and broader market indices like the DOW and NASDAQ. Traders also check Twitter feeds for option ideas. Sometimes traders visit past stocks traders've played to screen that are related to specific sectors that are moving.
2. Market Heatmap
Finviz's market heatmap is a useful tool for visualizing market sentiment. The heatmap divides the market into different sectors and provides a color-coded representation of how each sector performed on a particular day. As you mentioned, the upper triangle often represents sectors like technology, while the lower triangle tends to include more defensive sectors like consumer defensives, utilities, and real estate. The color (green for positive and red for negative) allows you to quickly assess which sectors are gaining or losing money. This heatmap allows traders to quickly assess which sectors are outperforming or underperforming, offering a strategic starting point for trade idea generation.
3. Market Sentiment Analysis
By observing the movement of money on the heatmap, you can gauge the current market sentiment. In bull markets, money tends to flow into technology stocks and away from defensive sectors. Conversely, during times of uncertainty or economic concerns (e.g., Fed interest rate announcements or cooling labor markets), money may shift towards more defensive sectors such as basic materials and energy. Understanding these shifts can help you make informed investment decisions. This heatmap allows traders to quickly assess which sectors are outperforming or underperforming, offering a strategic starting point for trade idea generation.
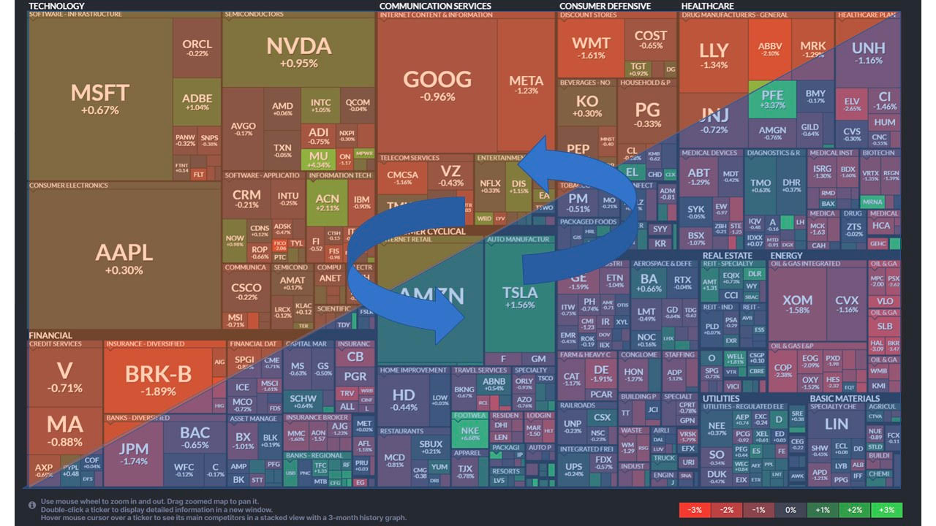
The example heatmap shows how money moves through the market. The map is cut into two triangles. Money moves from the top left, technologies, into the bottom right and vice versa depending on the market sentiment. In this picture, the technology sector was green for the day while money moved into tech, and the more defensive stocks were negative. As the market sentiment changes, then money moves to the lower right into basic materials, energy and other defensives. This heatmap allows traders to quickly assess which sectors are outperforming or underperforming, offering a strategic starting point for trade idea generation.
4. Stock Screening
In addition to the heatmap, Finviz's stock screener is another valuable tool for investors. It allows you to filter and screen stocks based on various criteria, such as price, volume, technical indicators, and fundamental metrics. This can help you identify potential trading opportunities or investment candidates. Here are the settings traders start traders screening with: This heatmap allows traders to quickly assess which sectors are outperforming or underperforming, offering a strategic starting point for trade idea generation.
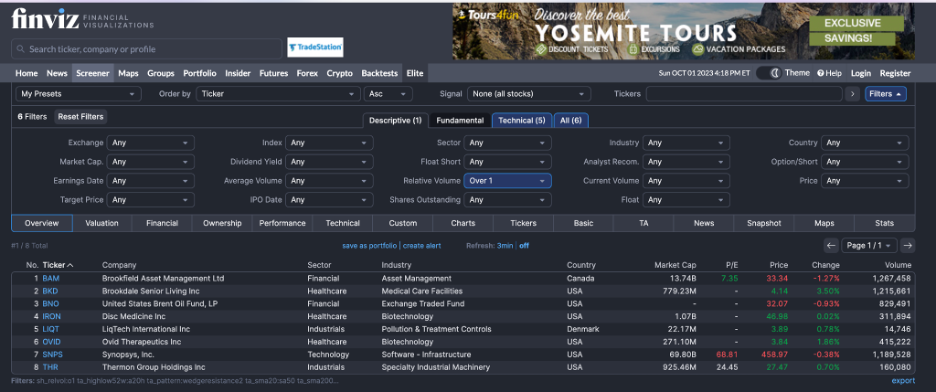
First, traders look for stocks with good volume. A stock without volume won’t have a lot of option contracts with it.
Second, traders like playing bulls. traders look for stocks that have good upward momentum. To do this, traders’m looking for stocks holding strong above their moving averages. Here are traders setting before traders start screening any further.

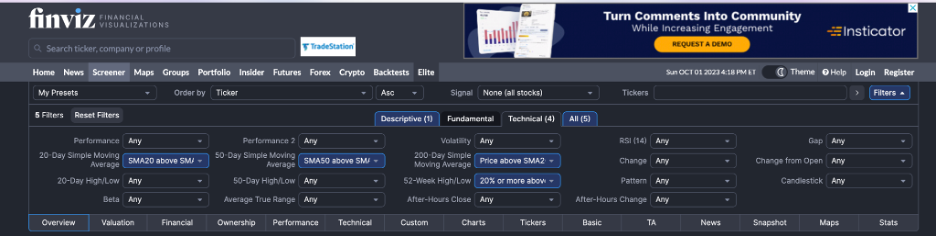
From this point, traders can continue to select and screen patterns with Finviz or traders can move into a more in-depth analysis with Tradingview.
5. Transition to TradingView for in-depth chart analysis
Look at momentum at specific levels (hourly, daily, weekly).
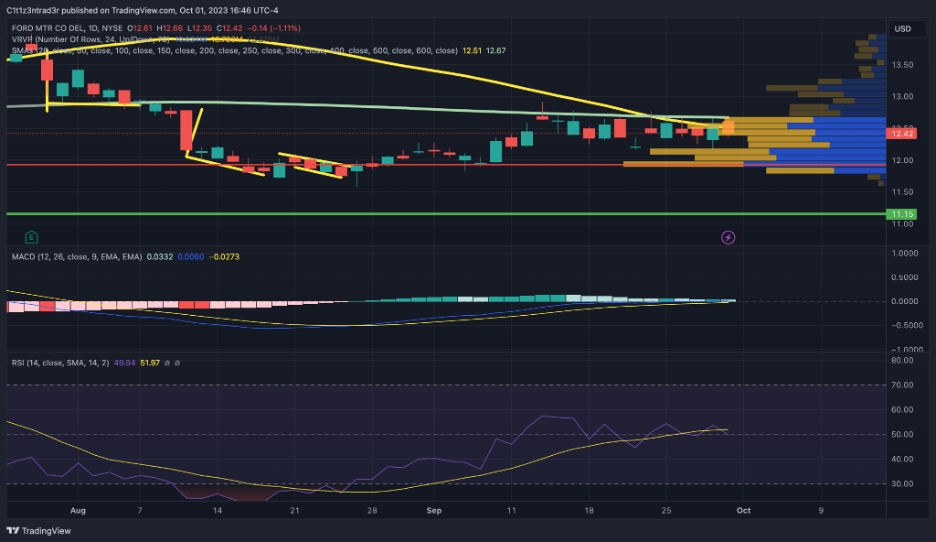
When diving into a more detailed look at a stock, Tradingview is Traders of the top charting tools available When traders’m at this point, traders and to look at the momentum of the stock at specific levels. Since, traders do a good bit of swing trading, traders look at charts at the hourly, daily and weekly levels. traders also use various indicators alongside candlestick patterns:
-
MACD (Moving Average Convergence Divergence): MACD is a momentum indicator that reveals the relationship between two moving averages of a security's price. It helps traders identify high levels of bullish or bearish momentum, aiding in pinpointing entry and exit points for trades. traders look at the overall trend as well as traders actual signal lines to help determine traders conviction for a trade. If the signal line is positive and the signal changes to bull, traders give more conviction to a pull trade.
-
RSI (Relative Strength Index): RSI is a momentum indicator used in technical analysis. It measures the speed and magnitude of recent price changes in a security to assess whether it's overvalued or undervalued.
-
VRVP (Visible Range Volume Profile): VRVP calculates the volume profile within the visible price range, making it useful for analyzing recent market trends. Traders utilize it to gain insights into recent volume-based trading activities. traders user VRVP to look for volume shelves that serve as points of support and points of resistance.
-
Moving Averages: Moving averages are widely used in technical analysis. They help smooth out price data by calculating a constantly updated average price, aiding traders in identifying trends and potential reversals. traders like using the 9, 50 and 200 day moving averages.
Tradingview has a ton of indicators and tools. traders’ve also written traders own tools using pine script to create custom indicators. Tradingview is an indispensable part of traders screening processes after choosing specific targets.
6. Always keep up with the latest business news
Resources like Yahoo Finance and TradingView's news alerts provide current information on stocks. If you’re watching your Tradingview chart, look for the lightning bolt symbol to quickly discover news alerts right from your chart.

TTC Wealth Inc. and the Citizen Trader Service is not a broker-dealer or investment advisor. It is a collaboration platform for the exchange of ideas and opinions for entertainment and educational purposes only. The content available on Citizen Trader has not been validated, is subject to change without notice, and should not be considered as investment advice or used in any way to make trading or investment decisions. It is not a substitute for extensive independent market research that should be independently performed elsewhere before making any investment or trading decisions. Read the full Disclaimer before using the Service.
You should always understand that PAST PERFORMANCE IS NOT NECESSARILY INDICATIVE OF FUTURE RESULTS.